|
Let me know using the "Contact Us" page if you find this blog useful. |
|
|
|
|
|
|
Use the Contact Us section of this site if you want to receive this Blog as an email every time it is published, or if you simply enjoy reading
it and want to encourage me to continue to write it.
_______________________________________________________________________________________
blog, noun, an
online journal, diary, or collection of thoughts; shortened form of web log.
_______________________________________________________________________________________
_______________________________________________________________________________________
A low-risk, high-reward
opportunity
Paul King, August 17th 2010
As disciplined
traders we should always be on the lookout for low-risk, high-reward opportunities and I have a great one for you today.
I recently gave a one hour presentation on the areas of trading that I believe are
key to success and it was recorded and turned into a webinar by Norman Hallett for part of his "Disciplined Trader Basics
Program".
Don't be fooled by the "Basics" in the title - this is practical, useful, and important
information for traders with any level of experience and background.
The "high-reward"
part is that my one hour webinar is only about one quarter of the material in the program.
The "low-risk" part is the fact that Norman (as always) is offering a 100% money-back
guarantee if you don't think the program is worth the price he's charging.
All you have to risk is a few hours of your time and a temporary charge on your credit
card!
You can find
out more detailed information, or enroll in the program using the link below:
http://www.thedisciplinedtrader.com/basics.php?10087
_______________________________________________________________________________________
US
Equity Setups
Paul King, May 10 2010 | Symbol | Name |
#1 |
#2 |
#3 |
#4 |
#5 |
#6 |
#7 |
Total |
| DF | Dean Foods
Compan | | -1 | -1 | -1 | -1 | | -1 | -5 |
This information
is for PMKing Trading coaching clients who have developed a complete US Equity Trading program and should not be construed
as a recommendation to enter any positions.
_______________________________________________________________________________________
US
Equity Setups
Paul King, May 5 2010 | Symbol | Name |
#1 |
#2 |
#3 |
#4 |
#5 |
#6 |
#7 |
Total |
| ITMN | InterMune
Inc. | -1 | -1 | -1 | -1 | -1 | -1 | -1 | -7 | | MYGN | Myriad Genetics | | -1 | -1 | -1 | -1 | | -1 | -5 |
This
information is for PMKing Trading coaching clients who have developed a complete US Equity Trading program and should not
be construed as a recommendation to enter any positions.
_______________________________________________________________________________________
US
Equity Setups
Paul King, May 3 2010 | Symbol | Name |
#1 |
#2 |
#3 |
#4 |
#5 |
#6 |
#7 |
Total |
| DTG | Dollar
Thrifty Au | | | +1 | +1 | +1 | | +1 | +4 |
This information
is for PMKing Trading coaching clients who have developed a complete US Equity Trading program and should not be construed
as a recommendation to enter any positions.
_______________________________________________________________________________________
US
Equity Setups
Paul King, April 30 2010 | Symbol | Name |
#1 |
#2 |
#3 |
#4 |
#5 |
#6 |
#7 |
Total |
| THOR | Thoratec
Corporat | +1 | +1 | +1 | +1 | +1 | | +1 | +6 | | ATHN | athenahealth Inc | | -1 | -1 | -1 | -1 | | -1 | -5 | | CSTR | Coinstar Inc. | | | +1 | +1 | +1 | | +1 | +4 | | VPRT | Vistaprint NV | | -1 | -1 | -1 | | | -1 | -4 |
This information
is for PMKing Trading coaching clients who have developed a complete US Equity Trading program and should not be construed
as a recommendation to enter any positions.
_______________________________________________________________________________________
US
Equity Setups
Paul King, April 29 2010 | Symbol | Name |
#1 |
#2 |
#3 |
#4 |
#5 |
#6 |
#7 |
Total |
| DNDN | Dendreon
Corporat | | +1 | +1 | | +1 | | +1 | +4 | | GTI | GrafTech Internat | | +1 | +1 | | +1 | | +1 | +4 | | BC | Brunswick Corpora | | +1 | +1 | | +1 | | +1 | +4 | | AKAM | Akamai Technologi | | +1 | +1 | +1 | +1 | | +1 | +5 | | HAR | Harman Internatio | | -1 | -1 | -1 | | | -1 | -4 |
This information
is for PMKing Trading coaching clients who have developed a complete US Equity Trading program and should not be construed
as a recommendation to enter any positions.
_______________________________________________________________________________________
Common Trading Myths
Paul King, April 28th 2010
In my next few blog entries I'm going to focus on some common trading myths that everybody seems to propogate as true,
but in reality there is little use in them even if there is a grain of truth there.
You know the kinds of things I'm talking about; conventional wisdom that gets taken as read without really testing it:
- Buy and hold investing returns 7% compound annual growth rate after adjustment for inflation
- The CPI is an accurate measure of inflation
- An inverted yeild curve is indicative of an equity bear market to come
- Periodic portoflio rebalancing controls risk
- Dividend paying stocks are good for your investment returns
I'm sure you can add another 10 or so items to this list of things that everyone tells you is true but you've never really
tested or thought about in any detail. If there are some ideas you've always wanted to know the truth about, or how
they can be useful to your trading, shoot me an email and I'll give you an opinion on it right here in this blog.
Watch this space - I'll be tackling inverted yield curves next...
_______________________________________________________________________________________
US Equity Setups
Paul King, April 27 2010
| Symbol |
Name |
#1 |
#2 |
#3 |
#4 |
#5 |
#6 |
#7 |
Total |
| NTY |
NBTY Inc. Common |
|
-1 |
-1 |
-1 |
-1 |
|
-1 |
-5 |
This information is for PMKing Trading coaching clients who have developed a complete US Equity Trading program and should
not be construed as a recommendation to enter any positions.
_______________________________________________________________________________________
US
Equity Setups
Paul King, April 26 2010 | Symbol | Name |
#1 |
#2 |
#3 |
#4 |
#5 |
#6 |
#7 |
Total |
| WHR | Whirlpool
Corpora | | | +1 | +1 | +1 | | +1 | +4 | | HTZ | Hertz Global Hold | | | +1 | +1 | +1 | | +1 | +4 | | LSCC | Lattice Semicondu | | | +1 | +1 | +1 | | +1 | +4 |
This information
is for PMKing Trading coaching clients who have developed a complete US Equity Trading program and should not be construed
as a recommendation to enter any positions.
_______________________________________________________________________________________
US Equity Setups
Paul King, April 23 2010
| Symbol |
Name |
#1 |
#2 |
#3 |
#4 |
#5 |
#6 |
#7 |
Total |
| ERIC |
LM Ericsson Telep |
|
|
+1 |
+1 |
+1 |
|
+1 |
+4 |
This information is for PMKing Trading coaching clients who have developed a complete US Equity Trading program and should
not be construed as a recommendation to enter any positions.
_______________________________________________________________________________________
US Equity Setups
Paul King, April 22 2010
| Symbol |
Name |
#1 |
#2 |
#3 |
#4 |
#5 |
#6 |
#7 |
Total |
| CMG |
Chipotle Mexican |
|
+1 |
+1 |
+1 |
+1 |
|
+1 |
+5 |
| NOK |
Nokia Corporation |
|
-1 |
-1 |
-1 |
|
|
-1 |
-4 |
This information is for PMKing Trading coaching clients who have developed a complete US Equity Trading program and should
not be construed as a recommendation to enter any positions.
_______________________________________________________________________________________
US Equity Setups
Paul King, April 21nd 2010
| Symbol |
Name |
#1 |
#2 |
#3 |
#4 |
#5 |
#6 |
#7 |
Total |
| TUP |
Tupperware Brands Corp |
|
|
+1 |
+1 |
+1 |
|
+1 |
+4 |
This information is for PMKing Trading coaching clients who have developed a complete US Equity Trading program and should
not be construed as a recommendation to enter any positions.
_______________________________________________________________________________________
What makes prices
move, Part II?
Paul King, March 30th 2010
In my previous blog entry I posed the following questions:
"Let’s have a little quiz about price movement. Imagine a company that issues 100 shares and each of them is purchased
at the IPO for $1 each by 100 investors. All the 100 holders of the shares are
unwilling to sell at any price and just want to hold onto the shares for the voting rights they bestow."
I'll now give you my take on the 5 questions and answers and also the implications for your trading.
| Question 1: |
What will the price of the shares be if there are no buyers?
Since there are no sellers and no buyers there will be no market for the shares and therefore
no price. This tells us that prices cannot move without participants willing to buy and sell at the same time.
|
| Question 2: |
What will the price of the shares be if buyers put in limit orders?
Since the sellers are unwilling to sell at any price it doesn't matter what
price buyers put on their limit orders - there will be no willing seller at that price. This tells us that prices cannot
move unless there are both buyers and sellers willing to trade at the market.
|
| Question 3: |
What will the price of the shares be if one person decides to sell but for
a price higher than the current highest buy limit order?
If the only seller requires a higher price than the current best bid then
no trade will take place. This tells us that for prices to move there must be someone willing to trade at the market
price.
|
| Question 4: |
What will the price be if one person decides to sell at the market price?
If someone is willing to sell at the market price, then the price will move
to the current best offer price. This tells us that price moving is about participants being willing to trade at the
market price.
|
| Question 5: |
What will the price be if there are always 100 people willing to sell at the
market price and simultaneously 100 people willing to buy at the market price?
If there are equal numbers of buyers and sellers at the market price then the share price will
not change - the shares will change hands at the same price. What this tells us is that price moves are caused by a
disequilibrium in the current volume of buy and sell market orders.
|
So in summary, prices move because of a temporary imbalance in the number
of buy market orders versus the number of sell market orders. Therefore, trying to predict future price moves is like
saying it's possible to predict when more market participants will put in buy or sell market orders at any particular point
in time. If you consider all the factors taken into consideration that may cause someone to hit the "buy" or "sell"
button in their account it becomes pretty obvious that it's not predictable or able to be modeled in an accurate way.
This is the reason that trading methods that rely on predicting future price moves and being correct
more than 50% of the time will always fail in the long run. The next tick is related to the previous one but depends
on how the balance of buy and sell market orders has changed - and that's just not realiably predictable.
_______________________________________________________________________________________
What makes prices
move?
Paul King, March 23rd 2010
It’s ironic that all of trading is about price moving since we can’t make a profit unless price moves in
some direction, but most traders when asked the question “what makes price
move?” can’t come up with a simple and elegant explanation in one sentence.
Some say it’s to do with supply and demand, and others to do with an imbalance in buyers and sellers, but the ideas
behind their answers are usually somewhat “fuzzy” to say the least.
Talking specifically about equities, for example, supply is fixed – it is the current number of shares outstanding,
and every trade has a buyer and a seller so they can’t be out of balance. Understanding
exactly what causes prices to move is essential to constructing a robust trading system because it also answers the question
“Is future price movement predictable?”
Let’s have a little quiz about price movement. Imagine a company that issues 100 shares and each of them is purchased
at the IPO for $1 each by 100 investors. All the 100 holders of the shares are
unwilling to sell at any price and just want to hold onto the shares for the voting rights they bestow.
| Question 1: |
What will the price of the shares be if there are no buyers?
|
| Question 2: |
What will the price of the shares be if buyers put in limit orders?
|
| Question 3: |
What will the price of the shares be if one person decides to
sell but for a price higher than the current highest buy limit order?
|
| Question 4: |
What will the price be if one person decides to sell at the market
price?
|
| Question 5: |
What will the price be if there are always 100 people willing
to sell at the market price and simultaneously 100 people willing to buy at the market price?
|
Once you’ve thought about and answered these 5 questions you should
have enough information to work out specifically what causes price to move and be able to articulate it in one simple sentence.
I’ll give you my answers and an explanation in my next blog entry and also address the other question I mentioned which
is “Is future price movement predictable?”
_______________________________________________________________________________________
What's
your edge?
Paul King, April 27th 2009
I recently
had a question from someone who read my book which was "What's an edge in trading?". Resisting the obvious answer that
if you don't know what an edge is then you don't have one and shouldn't be trading, I wrote back the following message:
In the simplest terms your "edge" is why you will succeed
in making money trading where many, many others have failed. Generally it is not one single thing, but rather an accumulation of small edges that lead to success. If
I had to define the most important edge it would be having a complete, written, trading business plan (that includes everything
mentioned in my book, by the way). Other examples of smaller (but still significant edges) would be:
· Using the lowest cost broker to minimize
trade implementation costs so that they do not outweigh potential trading profits (especially for high-frequency trading).
· Being well organized and disciplined
so trading implementation errors are minimized. Implementation errors can be the difference between a nice living and a total financial disaster,
especially when you are first starting out trading.
· Using sophisticated historical trading
system testing software to make sure your system or method is positive expectation in many types of market, and should definitely
make money over longer periods of time and many trades (assuming accurate implementation of course).
· Keeping yourself healthy, alert,
and happy so you can accurately implement your trading program. There is no point having a great
trading program if the biological part of your bio-mechanical trading machine (i.e. you) doesn't work properly and is the
weak link.
· Providing yourself with a fixed income
that pays your expenses that is not dependent on your trading results so that you can trade without fear of losing. Trading
"scared" money is setting yourself up to fail, because you cannot tolerate the normal draw-downs (and irregular income) that
any trading method generates.
In short, if you don't have a relatively long list of decent, well-defined
trading edges, then your odds of success are minimal; you'll simply be providing the profits for the traders who do have an
edge, know what it is, and aren't afraid of exploiting it.
_______________________________________________________________________________________
INO TV
Video Review, Gaming Theory
Paul King, April 22nd 2009
In this 80 minute INO TV presentation, Ron Shelton, a quantitative analyst/risk manager, explains the use of game theory and its application to risk
taking in trading. Using some real-world examples such as nuclear proliferation and earthquake insurance, Ron explains how
a payoff matrix can be constructed with probabilities and risks.
Next, a simple trading game is played to indicate how taking more
or less risk on a particular occasion and where stops are placed is key to understanding your trading results. It’s
refreshing to have a discussion of exits rather than entries as the most important aspect of a trading program although Ron
does not specifically make this point. My observation was that every participant got different results even though they all
had exactly the same entry time and price.
The last part of the presentation involves some detailed equations
and graphical representations of one possible (over-simplified due to time constraints) application of payoff matrices to
trading. By no means a comprehensive coverage of game theory in respect to trading, but should definitely give any intelligent
trader a few avenues for further study and research that will pay dividends when applied to their trading program development
and evaluation.

_______________________________________________________________________________________
Elliott
Wave International Free Week
Paul King, April 21st 2009
-
The U.S. Elliott Wave Financial Forecast ($19/month value)
-
The European Elliott Wave Financial Forecast ($29/month value)
-
The Asian-Pacific Elliott Wave Financial Forecast ($31/month
value)
Plus, the 120-page book includes analysis culled
straight from EWI's professional-grade Specialty Services, each of which is valued at $199/month. This means you also get
analysis and forecasts for the following global markets:
-
World stock markets (China, Japan, Korea, U.S, France, Britain
and more)
-
Global interest rates (Australia, Europe, Japan, U.S.)
-
International currency relationships (U.S. Dollar, Euro rates,
Swiss Francs, Japanese Yen and more)
-
Metals and Energy (Crude Oil, Gold, Silver, Natural Gas)
_______________________________________________________________________________________ Robert Prechter Government
Intervention Article
Jaguar Inflation - A Layman's Explanation of Government Intervention
February 6, 2009
This article is part of a syndicated series about deflation from market analyst Robert Prechter, the world’s foremost
expert on and proponent of the deflationary scenario. For more on deflation and how you can survive it, download Prechter’s FREE 60-page Deflation Survival eBook, part of Prechter’s NEW Deflation Survival Guide.
The following article was adapted from Robert Prechter’s NEW Deflation Survival eBook, a free 60-page compilation of Prechter’s most important teachings and warnings about deflation.
By Robert Prechter, CMT
I am tired of hearing people insist that the Fed can expand credit all it wants. Sometimes an analogy clarifies a subject,
so let’s try one.
It may sound crazy, but suppose the government were to decide that the health of the nation depends upon producing Jaguar
automobiles and providing them to as many people as possible. To facilitate that goal, it begins operating Jaguar plants all
over the country, subsidizing production with tax money. To everyone’s delight, it offers these luxury cars for sale
at 50 percent off the old price. People flock to the showrooms and buy. Later, sales slow down, so the government cuts the
price in half again. More people rush in and buy.
Sales again slow, so it lowers the price to $900 each. People return to the stores to buy two or three, or half a dozen.
Why not? Look how cheap they are! Buyers give Jaguars to their kids and park an extra one on the lawn.
Finally, the country is awash in Jaguars. Alas, sales slow again, and the government panics. It must move more Jaguars,
or, according to its theory — ironically now made fact — the economy will recede. People are working three days
a week just to pay their taxes so the government can keep producing more Jaguars. If Jaguars stop moving, the economy will
stop. So the government begins giving Jaguars away. A few more cars
move out of the showrooms, but then it ends. Nobody wants any more Jaguars. They don’t care if they’re free. They
can’t find a use for them. Production of Jaguars ceases. It takes years to work through the overhanging supply
of Jaguars. Tax collections collapse, the factories close, and unemployment soars. The economy is wrecked. People can’t
afford to buy gasoline, so many of the Jaguars rust away to worthlessness. The number of Jaguars — at best — returns
to the level it was before the program began.
The same thing can happen with credit.
It may sound crazy, but suppose the government were to decide that the health of the nation depends upon producing credit
and providing it to as many people as possible. To facilitate that goal, it begins operating credit-production plants all
over the country, called Federal Reserve Banks. To everyone’s delight, these banks offer the credit for sale at below
market rates. People flock to the banks and buy. Later, sales slow down, so the banks cut the price again. More people rush
in and buy. Sales again slow, so they lower the price to one percent. People return to the banks to buy even more credit.
Why not? Look how cheap it is! Borrowers use credit to buy houses, boats and an extra Jaguar to park out on the lawn. Finally,
the country is awash in credit.
Alas, sales slow again, and the banks panic. They must move more credit, or, according to its theory — ironically
now made fact — the economy will recede. People are working three days a week just to pay the interest on their debt
to the banks so the banks can keep offering more credit. If credit stops moving, the economy will stop. So the banks begin
giving credit away, at zero percent interest. A few more loans move through the tellers’ windows, but then it ends. Nobody wants any more credit. They don’t care if it’s free. They can’t find a use for it. Production of credit ceases. It takes years
to work through the overhanging supply of credit. Interest payments collapse, banks close, and unemployment soars. The economy
is wrecked. People can’t afford to pay interest on their debts, so many bonds deteriorate to worthlessness. The value
of credit — at best — returns to the level it was before the program began.
See how it works?
Is the analogy perfect? No. The idea of pushing credit on people is far more dangerous than the idea of pushing Jaguars
on them. In the credit scenario, debtors and even most creditors lose everything in the end. In the Jaguar scenario, at least
everyone ends up with a garage full of cars. Of course, the Jaguar scenario is impossible, because the government can’t produce value. It can, however, reduce values. A government
that imposes a central bank monopoly, for example, can reduce the incremental value of credit. A monopoly credit system also
allows for fraud and theft on a far bigger scale. Instead of government appropriating citizens’ labor openly by having
them produce cars, a monopoly banking system does so clandestinely by stealing stored labor from citizens’ bank accounts
by inflating the supply of credit, thereby reducing the value of their savings.
I hate to challenge mainstream 20th century macroeconomic theory, but the idea that a growing economy needs easy credit
is a false theory. Credit should be supplied by the free market, in which case it will almost always be offered intelligently,
primarily to producers, not consumers. Would lower levels of credit availability mean that fewer people would own a house
or a car? Quite the opposite. Only the timeline would be different.
Initially it would take a few years longer for the same number of people to own houses and cars – actually own them, not rent them from banks. Because banks would not be appropriating so much
of everyone’s labor and wealth, the economy would grow much faster. Eventually, the extent of home and car ownership
– actual ownership – would eclipse that in an easy-credit society. Moreover, people would keep their homes and cars because banks would not be foreclosing on them. As a bonus,
there would be no devastating across-the-board collapse of the banking system, which, as history has repeatedly demonstrated,
is inevitable under a central bank’s fiat-credit monopoly.
Jaguars, anyone?
……….
For more on deflation, download Prechter’s FREE 60-page Deflation Survival eBook or browse various deflation topics like those below at www.elliottwave.com/deflation.
Robert Prechter, Chartered Market Technician, is the world's foremost expert on and proponent of the deflationary scenario.
Prechter is the founder and CEO of Elliott Wave International, author of Wall Street best-sellers Conquer the Crash and Elliott Wave Principle and editor of The Elliott Wave Theorist monthly market letter since 1979.
_______________________________________________________________________________________
Malcolm Gladwell's
Latest Book
Paul King, November 24th 2008
| | In Gladwell's latest book "Outliers" the subject is success and what the main causes of it are. The
book is an interesting and informative challenge to the conventional wisdom that IQ is predictive of success and only the
most intelligent people can truly succeed.
As in Gladwell's previous works, Blink and The Tipping Point
the writing is clear, easy to understand, and engrossing.
A simple summary of Outliers is that success depends
on 2 major factors neither of which is IQ (assuming you're intelligent "enough"). The factors are: It
takes an estimated 10,000 hours of "practice" to really become an expert in anything, and those who are successful end up
with a unique opportunity to gain those 10,000 hours quicker than the average person. If you truly want to be successful
in any chosen field then this book points you in the right direction and can help to avoid situations where you're set up
to fail simply because the opportunity to become an expert simply isn't there for you. |
_______________________________________________________________________________________
Lessons learned from
an instant -1R loser
Paul King, November 5th 2008
In my previous blog entry I described how I managed to have an instant -1R losing trade (which I'd previously thought
could not be possible). After the initial anger at my computer, trading software, system, broker, exchange and everything
else, I've had time to reflect and see what I learned from this.
Firstly this clearly demonstrates
the usefulness of a "small size real-money" testing phase in your trading program development plan. If I'd been trading $10
million dollars with a 1% risk per trade, that mistake would have cost me $100,000 in about 10 miliseconds.
Also
important is a paper-trading phase using your broker's demonstration account (your broker does have a demonstration account
to allow you to test their software first don't they? If not, find a new broker!) to make sure the mechanics of your trading
program implementation are completely understood. I did have a paper-testing phase, but unfortunately all the limit orders
were not round numbers so they already had the required 2 decimal places so they executed properly.
Secondly,
it's very important to allocate blame correctly here. I typed in the order, I chose to use Interactive Brokers, I chose to
trade instruments on an exchange that has an 8 minute trade "bust" window, I chose to phone my broker up rather than use their
electronic trade bust request system (which they specificaly recommend using to avoid the situation I got into if i'd bothered
to investigate this before starting to trade this system).
If I blame the trading software, my broker,
the exchange, or anything else other than myself I'm not going to learn anything from this and probablly make bad decisions.
If I blame the exchange and their 8-minute bust window I would not be able to trade the SOS system at all since that's where
most of the instruments I want to trade are listed. My loss.
If I blame my broker, I'd be forced
to move my accounts to an inferior broker (IMHO) since I did a lot of research to make sure I was trading using the best broker
currently available for the instruments I want to trade. My loss.
If I blame the trading software,
I'd be forced to stop using it and phone in orders every time I wanted to execute a trade. This would create far more potential
for errors than my current method of 100% electronic trade entry and management. My loss.
Unless
I take personal responsibility for the mistake I can't learn from it, put things in place to prevent it happening again, and
continue trading in the most efficient way I possibly can. This has been my policy from the very start of my trading carreer
and I believe it has allowed me to excel as a trader more than any other fundamental decision I have made regarding my trading
business.
The moral of the story:
There are an infinite number of diverse, new, and
interesting ways to screw up your trading. Make sure to take responsibility for them when you cause them to happen and you
will eventually make (and learn from) enough mistakes to consider yourself to be competent. This is what experience is and
it's how good traders get to be good. Take responsibility for your actions and you will have an edge over everyone who just
blames something or someone else for their mistakes.
_______________________________________________________________________________________
How to generate an
instant -1R loser
Paul King, November 4th 2008
Yesterday I had my first instant -1R loser ever. (1R is the initial risk on the trade determined by where your initial
stop is). If you're familiar with the concept of using an initial stop to determine R then you'll be wondering how it's possible
to actually generate an instant -1R loser. I didn't know it was possible until yesterday so I thought I'd write a blog entry
about it.
I've recently finished developing a trading program that is short volatility by selling out of the money options on futures
contracts. I call it the "short option strangle" program or SOS for short. Fortunately I'm in small-size real-money testing
at the moment to see if there are any implementation "problems" (exactly like the one I encountered) before risking any "real"
capital on the system.
I got a signal to short a Gold futures strangle. The price for the combination
was about $4.5 bid, $9.30 offered (spreads are relatively wide with these options) so I put a limit order in for $9 for the
combination hoping to be filled on a short-term volatility spike. Imagine my surprise when the sell order was filled immediately!
I checked the trade execution report and was horrified to see my fill price had been 90c not $9.
This
represented an immediate loss of $840 per contract (based on the current offer price of $9.30 for the combo - each $1 price
move represents $100 for this futures option). The trade did not show up as the last traded price for the option contracts
in my real-time data feed so I knew something was going on.
I called my broker (Interactive Brokers).
I was on hold for about 10 minutes before I got through to someone. I explained the situation and they told me that since
I'd typed in 9.0 instead of 9.00 for the limit price, it had been interpreted by the exchange (GLOBEX) as a limit price of
90c. I told them that was a) insane, and b) way outside the current bid/ask anyway, and c) hadn't shown up as an executed
trade in my data feed. I asked them to "bust" the trade since it was clearly erroneous. The rep said he'd investigate and
call me back.
About 30 minutes later I got a call back. Apparently the exchange has a "no bust after
8 minutes" policy so the trade would stand. All they would do was to agree to change the price to $3.50 rather than 0.9c.
This reduced the loss from $840 per contract to $580 per contract. As you can imagine, I wasn't really thrilled by this
concession. After another 10 minutes of arguing with the rep I realized there was nothing I could do - the broker blamed
the exchange for not busting the trade, the exchange blamed the broker for not asking for a trade bust within 8 minutes, and
I was wasting my time arguing about it.
So what can we all learn from this? That's the interesting
part and I'll be writing about that soon.
_______________________________________________________________________________________
Banking Meltdown Warning
Paul King, July 16th 2008
I've recently been warning my financial advice clients to make sure at the very least they have no more than $100,000
in any one FDIC "insured" account. This is so that they don't fall foul of the 50c on the dollar loss that IndyMac Bank
depositors recently sustained for deposits over $100,000.
Reports are that the IndyMac Bank meltdown cost the FDIC up to $8 billion of its $52 billion insurance fund. At
that rate it can only afford to bail out another 6 banks before there's no more cash left to pay with (wonder what happens
then?). How would you feel about a life insurance company that only had enough cash to pay out on 6 of its insured client's
life insurance policies?
According to the FDIC web site as of November 2007 (latest numbers available) there was about $4 trillion in US deposits,
and the insurance fund was just over 1% of that. Not a good margin of safety if you ask me. Anyway, Elliott Wave
International has a free report on the 100 "safest" banks. It's not quite time to take your cash and stuff it under the mattress
yet, or start buying gold bars, or creating a local barter-based economy, but it's certainly worth checking out whether your
bank is on Bob Prechter's list or not. Details below: Free Report: Discover the Top 100 Safest U.S. Banks
Most of us think the term "deposits" mean funds that you deliver to the bank for safekeeping, but for nearly
200 years, the courts have sanctioned an interpretation of the term "deposits" to mean a loan to your bank.
Combine that fact with the latest headlines you’re reading about big name banks needing bailouts and
you have a rude awakening of just how unsafe your bank may be.
Get expert, informed, and independent information on what you can do to protect your money, right now.
Elliott Wave International, the world’s largest market forecasting firm, has just released a free report,
Discover the Top 100 Safest U.S. Banks.
The free report will show you:
-
The Top 100 Safest U.S. banks (two for each state)
-
How you can choose a safe bank.
-
Five incredibly risky banking conditions.
-
How even the FDIC can't really guarantee your money.
-
Tips on international safe banking.
--------------------------------------------------------------------------------
About the Publisher,
Elliott Wave International
Founded in 1979 by Robert R. Prechter Jr., Elliott Wave International (EWI) is the
world's largest market forecasting firm. Its staff of full-time analysts provides 24-hour-a-day market analysis to institutional
and private investors around the world.
_______________________________________________________________________________________
 All Systems Go™ Online
Trade Simulator and Analyzer All Systems Go™ Online
Trade Simulator and Analyzer
Paul King, May 21st 2008
The beta version of the online trade simulation and analysis product "All Systems Go" is now released.
You can try it out here.
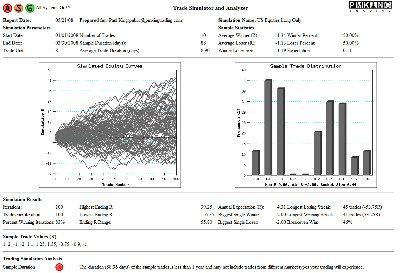 |
The thumbnail to the left shows part of the example output from the simulator.
Simply
plug in a sample of real or hypothetical/historical trades and press the "Simulate" button to produce a simulation of the
variability of your trading, and also an analysis of the quality of the trade sample.
|
Please send any bug reports, comments or feedback using the 'Contact Page' on this site. If you want any help interpreting the results of a simulation please send me an email. Please bear in mind
that while the product is in beta testing (and free to use) I have limited resources to answer questions.
_______________________________________________________________________________________
The "High Probability Entry" fallacy
Paul King, April 28th 2008
A lot of time in trading is spent (I'd say wasted) looking for so-called high probability entries, but what
exactly does that mean? Generally it's trying to identify patterns in price/volume/fundamental/economic data that identify
when there is a detectable bias to the future price trend of a tradable instrument.
There are a couple of problems with this approach:
1. Over what timeframe is this future directional bias supposed to operate? If it's significantly less
than your estimated average trade duration then what real use is it?
2. For every positive/reinforcing example of your high probability entry how many negative examples are there?
If this pattern only manifests itself in a small amount of data, or price moves counter to the predicted direction in about
50% of the cases, then is there really a cause/effect or predictive relationship going on at all?
If you do happen to identify a possible pattern with an edge, that doesn't have many counter-examples, occurs
with sufficient frequency to test, and has accurate historical data available so you can backtest it, then try this simple
test to see how effective it really is:
Once you've programmed your system/pattern and have a nice looking historical equity curve then, leaving everything
else the same (i.e. instrument selection and ranking, position sizing, exit strategy), reverse the entry signal and see how
this affects the results.
I've yet to find a long/short "high probability entry" that doesn't provide similar results when it's reversed
leaving everything else the same. What does this tell me? Entry signal does not determine trade winning percentage
or winner size - exits and position-sizing do that, so the term "high probability entry" is really an oxymoron to me.
What a particular pattern is really determining is a) the entry frequency, and b) whether you're getting into
a tradable instrument that's moving about or stagnant. Neither of these has anything to do with what happens next
in any particular trade. However, obviously a pattern that generates more entries in instruments that are moving right
now has a better chance of capturing trends (in either direction) than one that generates less signals, or signals
in instruments that are "stagnant" as far as price movement goes.
Stop "wasting" time on entry patterns and start working on position-sizing and exit strategies and you'll
see an immediate positive effect on your trading.
_______________________________________________________________________________________
Are you fit to trade?
Paul King, March 31st 2008
Every time you sit down at your trading computer and make a trading decision you should have already asked
yourself a simple question first:
Am I fit to trade today?
It's all too easy, once you have a well-defined trading method, or a few months (or even years) of experience
behind you to get complacent and start thinking you're a mechanical trading machine that never makes any errors.
Forgetting that trading is a difficult activity to do accurately, consistently, and repeatedly without making
any serious implementation errors can lose you many month's worth of profits in a single error.
When you wake up each morning take a moment while you're lying there waiting for your brain to boot up to
think about how you feel. Start off with a physical check:
- Does anything hurt or ache?
- Do you still feel tired?
- Do you have plenty of energy?
Then move onto a mental checkup:
- Is anything mentally bothering you?
- Are you ready and happy to go to the office?
- Do you feel alert and ready for the day?
I tend to simplify these questions into a daily "score" and then have some rules about what I can and can't
do depending on how low (low is bad) my score is. For example if I don't score high enough then I may decide to simply
manage existing positions rather than putting on any new trades. This means I'm not making important decisions when
I'm not feeling 100%.
Obviously your fitness score can, and should, be changed as you go through your daily morning routine.
Sometimes, a little tiredness just needs a good hot shower to fix it. Or some slow breathing when you get to the office
may improve your mental state.
The important thing is not to be expecting full performance if you're not 100% fit. It is OK to suspend
trading if you're at a disadvantage mentally or physically that can more than eliminate any trading edge you have when you're
100% fit. If you keep a diary of your "fitness score" versus any implementation errors you make then it should be relatively
easy to see how your error rate increases as your fitness score decreases and then you can implement rules about how to reduce
your trading activity when your fitness score is not high enough.
If you're trading when not fully fit you simply increase your chances of making an error, and that is the
root cause of failure for traders that do have a complete and effective trading method already defined. Don't take the
risk, it's not worth it.
_______________________________________________________________________________________
Little mistakes can mean a lot
Paul King, March 25th 2008
Recently a trader I know made a small typographic error that cost him nearly $100,000 in 8 minutes and it
could have been much worse. Instead of buying a couple of hundred shares of something, he entered an order for over
100,000 shares. This was because the order entry platform he used defaulted to a size of 100 and he didn't replace it
with his required order size, but added his order size to the end by mistake.
A brief analysis of the 10 main errors that were made is summed up below:
1 He was tired, so shouldn't have been trading at all.
2 He was on the phone at the same time as entering orders, causing a distraction and a loss of concentration.
3 He didn't check the order confirmation immediately after he'd entered it.
4 It was right before the close, so it was too late to get out of the position when the error was detected.
5 He did not know how to participate in the end-of-day auction process to possibly exit the position immediately
(this was not a US trade).
6 The market was very volatile (compounded by the large exit order) the next day so slippage was big.
7 He over-estimated the liquidity available at the open the next day and assumed that he would have similar
slippage on exit to what had occurred on entry.
8 He entered a market order for the whole position instead of scaling out or using limit orders.
9 He did not know how to enter a pre-market auction order to exit the position with less slippage.
10 He didn't have a written plan for what to do in the event of this kind of simple trading error.
One mistake that he didn't make was that he exited the position as soon as he could. Keeping the position
(that was 50 times bigger than intended) to "see shat happens" could have turned into the kind of situation that puts you
out of the trading game for a long time (if not permanently) rather than costing you a couple of month's profits.
The moral of this story is twofold:
1 Have a written contingency plan for every problem you can think of.
2 Have rigid procedures for why, how, and when you will put trades on and take them off (and follow them on
every trade).
3 Analyze, record, and quantify your mistakes and put things in place to reduce the chances of them happening
again.
In my experience most mistakes cost you money, are nearly always preventable, and if you learn from them,
the chances of them happening again (or costing you as much) are significantly reduced. Steps that should be put in
place to prevent this kind of mistake again would be:
1 Have a method of evaluating whether you are "fit to trade" and if not, have someone else you can delegate
the trading to, or even suspend trading for a while until you are fit.
2, 3, 4 Have a written checklist for trade entry (including confirmation that the correct trade was placed)
and follow it on every trade. Don't trade right before the close since you won't have time to fix any mistakes when
they do happen.
5, 6, 7, 8 & 9 Always fully understand the dynamics, personality, and mechanics of your chosen markets
before you start trading.
10 A full written business plan, operational plan, and contingency plan for your entire trading business is
essential if you are going to avoid making mistakes that can easily overwhelm any positive expectation of profit from your
trading programs.
Having a suite of trading programs that can make 20% return per year is useless if you make 30% worth of implementation
errors! Learning from, reducing, and attempting to eliminate implementation errors is a very important factor in success.
As Dan Harrington says about poker:
"..in the very long run, your results at the poker table will approach the sum of your opponents'
mistakes, less the sum of your mistakes".
You are never in control of your opponents' mistakes in trading, but you can try to ensure that the "sum of
your mistakes" is a very small number and in doing that you will greatly increase your chances of success.
_______________________________________________________________________________________
So much to do, so little time
Paul King, February 28th 2008
It's hard to believe that it's been 7 months since I've had the time to post to my blog, but I've been a little
busy developing a suite of trading programs for a US-based hedge fund I'm helping to launch for a UK client. If you want more
details about that then please use the "Contact" page or shoot me an email.
For those of you that would like a nice summary of the previous blog entries I feel are most valuable and informative,
I've published them in a little paperback called "Trading Truths" which contains all the best blog entries I've written since
I started it in 2002.
It's only available from Lulu.com right now since I haven't puchased an ISBN for it yet.
Click here to order a copy for $9.95
In other news, look out for an article in Futures magazine by me in the March 2008 edition and, you never know, I might
just find a few minutes to do some more blogging here in the near future.
I've also been working on whether trend lines are actually useful in trading and part of that work includes some code that
constructs automatic trendlines (in TradeStation) and I've included that below for your information.
// Automated Trendlines by Paul King, PMKing Trading LLC, (C) 2008 All Rights
Reserved
variables:
float HH1(0), // First highest high
float HH2(0), //
Second highest high
float LL1(0), // First lowest low
float LL2(0), // Second lowest
low
int HH1Bar(0), // Bar of highest price
int HH2Bar(0), // Bar of next highest price
int
LL1Bar(0), // Bar of lowest price
int LL2Bar(0), // Bar of next lowest price
int Pause(5), //
How long to wait to test for next highest high
float HighTrendLine(0), // High Trend line
float LowTrendLine(0), //
Low Trend line
float HighDailyMove(0), // Daily move in down trend line
float LowDailyMove(0); // Daily move
in up trend line
inputs:
int Lookback(50);
// Highest Highs trendline
// Find new reference high
if BarNumber>Lookback
and HH1Bar=0 then begin
HH1=Highest(High,Lookback);
HH1Bar=BarNumber-HighestBar(High, Lookback);
end;
// Reset HH2 if line far away
if HighTrendLine<>0 and AbsValue(HighTrendLine-HH2)>(AvgTrueRange(Lookback)*2)
then begin
HH2=0;
HH2Bar=0;
end;
// Find next high
if HH1Bar <> 0 and BarNumber >= (HH1Bar + (Pause))
then begin
HH2=Highest(High,BarNumber-HH1Bar-Pause);
HH2Bar=BarNumber-HighestBar(High,
BarNumber-HH1Bar-Pause);
If HH1Bar=HH2bar then HighDailyMove=HH2-HH1 else HighDailyMove=(HH2-HH1)/(HH2Bar-HH1Bar);
end;
if HH2Bar<>0 and BarNumber>HH2Bar then HighTrendLine=HH2+(HighDailyMove*(BarNumber-HH2Bar));
// Reset if trend line broken or HH1 too long ago
if (HH2Bar <>0 and
BarNumber> HH2Bar+Pause and Close>HighTrendLine or (BarNumber>(HH1Bar+(lookback*2)))) then begin
HighTrendLine=0;
HH1Bar=0;
HH2Bar=0;
HH1=0;
HH2=0;
end;
// Reset HH1 if too long ago
if (BarNumber>(HH1Bar+(lookback*2))) or AbsValue(Close-HighTrendLine)>(AvgTrueRange(Lookback)*10)
then begin
HH1=0;
HH1Bar=0;
HighTrendLine=0;
end;
if HighTrendLine > 0 then plot1(HighTrendLine,"High Trend",LightGray);
if
HH2>0 and BarNumber=HH2Bar then plot4(HH2,"HH2",LightGray);
// Lowest Lows trendline
// Find new reference low
if BarNumber>Lookback
and LL1Bar=0 then begin
LL1=Lowest(Low,Lookback);
LL1Bar=BarNumber-LowestBar(Low, Lookback);
end;
// Reset LL2 if line far away
if LowTrendLine<>0 and AbsValue(LowTrendLine-Close)>(AvgTrueRange(Lookback)*2)
then begin
LL2=0;
LL2Bar=0;
end;
// Find next low
if LL1Bar <> 0 and BarNumber >= (LL1Bar + (Pause))
then begin
LL2=Lowest(Low,BarNumber-LL1Bar-Pause);
LL2Bar=BarNumber-LowestBar(Low,
BarNumber-LL1Bar-Pause);
If LL1Bar=LL2Bar then LowDailyMove=LL2-LL1 else LowDailyMove=(LL2-LL1)/(LL2Bar-LL1Bar);
end;
if LL2Bar<>0 and BarNumber>LL2Bar then LowTrendLine=LL2+(LowDailyMove*(BarNumber-LL2Bar));
// Reset if trend line broken or LL1 too long ago or trend line too far away
if (LL2Bar <>0 and BarNumber> LL2Bar+Pause and Close<LowTrendLine) or (BarNumber>(LL1Bar+(lookback*2)))
then begin
LowTrendLine=0;
LL1Bar=0;
LL2Bar=0;
LL1=0;
LL2=0;
end;
// Reset LL1 if too long ago or trendline too far away
if (BarNumber>(LL1Bar+(lookback*2)))
or AbsValue(Close-LowTrendLine)>(AvgTrueRange(Lookback)*10) then begin
LL1=0;
LL1Bar=0;
LowTrendLine=0;
end;
if LowTrendLine > 0 then plot2(LowTrendLine,"Low Trend",DarkGray);
if
LL2>0 and BarNumber=LL2Bar then plot3(LL2,"LL2",DarkGray);
_______________________________________________________________________________________
Trends are not the same in both directions
Paul King, July 6th 2007
Consider the chart below (click it to download a larger pdf) 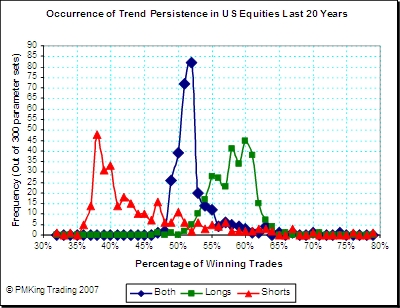
The chart shows the "persistence" of trends in liquid US equities over
the last 20 years. A trend is defined as an X times the Average True Range over Y days move over Z days. The price
is then inspected time T days later to see if it was up or down. The number of times the price had moved in the direction
of the trend was then counted for 300 different parameter combinations of X, Y, Z and T.
As you can see from the chart, overall there is no trend persistence in the US equity market since
the winning percentage for all the system instances tested clusters around 50% (i.e. random chance).
What is interesting is the big difference between trend persistence of up trends versus down trends.
Trend persistence in an upward direction is much more prominent than that in a downward direction. Some of the difference
can be explained by the "survivorship bias" in the data set used in that the best down-trending equities (i.e. the ones that
went bankrupt) are not included.
However, the significantly difference results in downward trend-persistence indicates that there
is a fundamental difference between the way that prices trend up and down (for US equities anyway). This asymmetry must
be understood, accounted for, and adapted to in your trading method if you attempt to trade both long and short.
_______________________________________________________________________________________
Markets Price Moves are Not Normally Distributed
Paul King, June 25th 2007
Consider the chart below (click it to download a larger pdf) 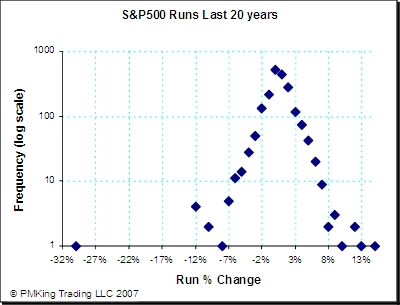
The chart shows the frequency and size of runs in the S&P 500 over
the last 20 years. A "run" is defined as a consecutive daily move in the same direction from close to close. For
example, if the S&P500 moved +1% then +2% then +0.5% on 3 consecutive trading days, that would be counted as a run of
+3.5%.
There are a couple of things worth noting about this chart. One is that there are more severe
outliers to the left, which means that more significant runs occur on the downside when markets crash. The other is
that the distribution is not the normal bell shape that indicates that it is normally distributed. The frequency and
size of moves (especially on the downside) are too great and too frequent to be "normal". The number of runs around
-12% should not exist and the one at nearly -32% should have almost a zero probability (if price moves were normally distributed).
The higher frequency of the "outliers" to the left and right of the chart are referred to as "fat
tails" and mean that "all bets are off" when it comes to estimating the size and frequency of market moves using regular statistical
and mathematical models that assume a normal distribution (also called a bell-shaped, or Gaussian distribution after the German
mathematician Carl Friedrich Gauss).
The fact is that larger than expected moves occur much more frequently than statistics would have
us believe, and your trading better adapt to this reality or you will be in for a big disappointment sometime in the near
future
_______________________________________________________________________________________
What Good Looks Like
Paul King, June 20th 2007
Evaluating the performance of your own (or somebody else's) trading is not as straightforward as it seems.
You need to take all the following things into consideration:
- The objectives of the trader or the method
- The risk adjusted return
- The margin usage or leverage
- The implementation errors
- The volatility of returns
- The time period of the sample performance
Unless you know what objectives the trading system or method was designed to meet, how can you tell if the
achieved performance is good or not? Achieving high returns with low drawdowns is not necessarily indicative of a "sound"
trading method - it's likely to be due to luck, or trading methods where the small risk of a very large "blowup" just have
not manifested themselves yet.
Return is only useful in the context of risk (e.g. drawdown). Most sound trading methods have a return
that is similar to the maximum normal drawdown. Look at the largest drawdown ever in relation to the annual percentage
return to give you an idea of risk-adjusted return.
Margin or leverage can be used to trade at a size that bears little relation to the actual amount of cash
available. This can distort any percentage return figures or drawdowns. It's the ratio of the two that's important
not the absolute percentages.
How many implementation errors are being made? If you have a fully defined method it should be possible
to determine how the actual return differs from the theoretical "perfect" return if you made zero implementation errors.
A sign of good trading is a gradual reduction in the number of implementation errors as the method matures and the trader
becomes experienced at implementing it.
Volatility of returns is normally more important than the absolute percentage returns. Achieving consisted
returns is often better than bigger, but more volatile returns, to most traders and investors.
Any trading method will take a number of years to exhibit the true overall performance characteristics inherent
in it. Looking at small samples over only a few months is not representative of most trading methods, especially those
that take a small hidden (but non-zero) chance of a huge loss.
There's more to trading results than compound annual growth rate, and one needs to do a detailed analysis
of the trading behind the numbers to really draw a conclusion about what "good" looks like for any particular set of performance
figures.
_______________________________________________________________________________________
Why Trend Following Works
Paul King, June 12th 2007
Trend following is a well known, widely used trading method, that goes into and out of favor like the wind.
Critics, academics, and traders alike either swear by it or discount it. What is it about trend following that means
it works at all?
Why trend following works is closely related to why it's psychologically hard to stick to. With a low
winning percent (usually around one third of trades) it means you get to be wrong a lot. This may be demoralizing if
you're more concerned with being right than making money. Loser after loser can mount up and feel like the proverbial
"death by a thousand cuts". Months or even years can go by with nothing to show for your trading discipline except a
smaller account balance.
All this for an infrequent huge boost from a small percentage of outsized winning trades that come along just
after you've given up thinking you'll ever have a winner again. But you kept trading anyway because you like the pain
right?
This profile of lots of smallish losers interspersed with a few massive winners is exactly what makes trend
following so hard, and also makes it a successful strategy. To ride big winning trades you need wide stops, way outside
the daily noise, and outside the inevitable two or three ATR reversals that most good trends contain.
Wide stops means smaller positions (if you risk a similar amount on each trade). This means you are less
prone to a huge hit from prices gapping straight through your stop. It also means trend following is pretty boring as
trading goes, so if you're in it for the excitement you won't last long either.
All in all, trend following can be a very lucrative and successful strategy but only if you're psychologically
adapted to the pain it can inflict on the inexperienced trader. There's no gain without pain, and trend following can
be financial agony if you're not mentally prepared for it.
_______________________________________________________________________________________
Pairs Trading - Part 2
Paul King, June 7th 2007
In my previous blog entry I outlined briefly what pairs trading is. In this blog entry I'm going to
discuss some of the main assumptions that this trading method is based on so you can make a decision about whether it's a
good idea or not for you.
Assumption 1
The correlation between the 2 instruments in a pair is permanent, stable, and long-term (at least for
the life of your trade).
This is a big assumption. Correlated price movement between 2 instruments is not predictable.
It could be due to random chance, it could be due to a fundamental reason that may change. It could be a genuine correlation
that will persist for the life of your pairs trade. Beware choosing pairs that look like they are correlated but don't
have a fundamental reason why they should be - it could just be random chance.
Assumption 2
Correlated pairs like the one described in assumption 1 exist.
If you cannot find liquid instruments that exhibit correlated behavior then this whole method cannot work.
Assumption 3
There are times when the spread between the 2 correlated pairs is "much larger than average" and represents
a profit opportunity.
If the correlation between the pair is "too perfect" there will never be times when the spread is wide enough
to give a decent profit by taking the trade. This is a paradox of pairs trading - you need to find pairs that are closely
correlated on a permanent basis, but not all the time!
Assumption 4
You are able to short the side of the pair that is going down.
Since a pairs trade is long one instrument and short the other, if you can't put on the short side of the
trade then it's no use finding pairs. This can be a particular problem for equity pairs trades where the short side
of the trade is not available for borrowing from your broker, and does not have actively traded put options as an alternative.
Assumption 5
The pair does actually revert to the mean spread and you take your (small) profit.
What if the "permanent" correlation between the two instruments has broken down and they will not "revert
to the mean"? You will have 2 positions that can both go against you. Where do you admit that the trade is not
working? How much is the loss compared to the potential for profit?
Overall when one looks at the underlying assumptions of pairs trading it seems like a lot of things have to
be true for it to work as a viable trading method. Also with the small profit targets and tight stops the position-sizes
tend to be very large in order to generate a decent return. This can lead to a single large adverse event losing the
equivalent of many, many, winning trades.
My advice would be to carefully evaluate the suitability of this method for your own trading purposes before
risking any cash.
_______________________________________________________________________________________
Pairs Trading - Part 1
Paul King, June 1st 2007
Assumptions are a big part of trading and understanding what assumptions a particular trading method is based
on is a key part of trading success. Some trading methods assume (and attempt to benefit from) trends or momentum of
price movement while others assume some kind of "mean reversion". Understanding which camp your trading methods fall
into is an important concept.
Pairs trading falls into the "mean reversion" camp. Pairs traders follow the method outlined below:
1 Find two instruments that have a close correlation of price movement (i.e. they generally move up and down
together).
2 Determine what the variability of the "spread" between the prices of the two instruments has been historically
by either dividing the price of one by the other, or deducting the price of one from the other.
3 Identify when the spread is above average (i.e. the prices have moved wider apart than normal).
4 Go short the instrument that has moved up and long the instrument that has moved down.
5 Capture the profit when prices "revert to the mean" i.e. the spread returns to "normal".
There are a whole bunch of assumptions that underlie the success of this trading method and in my next blog
entry I'll discuss them and give you my opinion on whether they are useful assumptions or not.
_______________________________________________________________________________________
The Four States of Trading
Paul King, May 23rd 2007
Trading is a bio-mechanical process.
You have a method which outlines your trading rules (even if they are random) which is the "mechanical" part, and you have
the trader deciding whether to implement each rule which is the "bio" part. This classification gives rise to the following
4 states your trading can be in:
1 - Unsound/incomplete method + Poor Discipline/Psychology = Failure
2 - Unsound method + Good Discipline = Failure
3 - Sound Method + Poor Discipline = Failure
4 - Sound Method + Good Discipline = Success
As we can see, without both a sound method and good discipline to implement it, trading
cannot be successful. Common reasons for an unsound method include:
- Incomplete trading rules
- Trading rules based on beliefs that are untrue or not useful
- Over-complicated trading rules
- Trading rules "curve-fit" to past data
- Trading rules that take too much risk per trade
Common reasons for little trading discipline include:
- Poorly defined objectives
- The wrong reasons for trading leading to self-sabotage
- Trading with "scared money"
- Plain old laziness
- Lack of education about markets, instruments, and trading in general
- Not taking responsibility for mistakes
Putting this all together to create a complete and sound trading plan that meets your objectives and suits
your personality is not something that most people find easy to achieve without expert help. This is the primary reason
for trading failure in my opinion and why finding someone who can help you before risking real cash is usually a good idea
(in hindsight of course).
_______________________________________________________________________________________
Ringer Stocks
Paul King, May 15th 2007
Most people know that Lexus is
owned by Toyota and that there are a lot of common parts including the chassis on some Lexus models. Would you pay up
for a Lexus if all they did was slap a different Logo on a Camry and hike up the price? That's what you're doing if
you buy "ringer stocks" as I call them.
So what is a "ringer stock"? It's the financial world's equivalent of a beat up old Camry dressed up
as a brand new Lexus. All major exchanges have minimum listing guidelines for the price of a stock. For example
the price of a NASDAQ stock must stay above $1. If it drops below $1 the company may be de-listed from the exchange
and be relegated to the oblivion of the "over the counter pink sheet" market.
So, what should you do if your business is going nowhere, your stock price is sub-$1 and you're going to be
de-listed? Easy, slap on the Lexus badge and carry on like nothing happened. How do you do this? A reverse
stock split and a name/ticker symbol change, that's how. Everyone has heard of a stock split where you get, say, 2 shares
for every one you currently own, and each one is worth half the price (like cutting a cake in two). A reverse split
is where you end up with less shares outstanding, and each one is "worth" more (like gluing the pieces of a cake back together).
A NASDAQ stock trading at 0.90c that does a 1 for 10 reverse split is suddenly trading at $9 per share and can avoid de-listing
assuming the market capitalization is above $5 million.
The historical prices for the stock get adjusted for the split (i.e. multiplied by 10 in this case) and if
you change the ticker symbol (and the company name for good measure) at the same time there's no way to even know that the
split has taken place just by looking at a regular stock chart. Hey presto, you look just like a Lexus rather than a
beat up old Camry and the good old general public (who didn't see the reverse-split/name change news) are none the wiser.
Nice trick if you can pull it off.
_______________________________________________________________________________________
Product Review: A New Look at Exit Strategies from InvestorFLIX
Paul King, May 8th 2007
It is unusual in the trading business
for someone to actually focus on the right things. This DVD presented by Charles LeBeau is the exception to the rule
and almost all the information presented here is "spot on".
Although the presentation is relatively old (Charles mentions that he uses TradeStation version
4.0 at one point) the content is timeless in that it discusses sound exit strategies and their importance in successful trading.
Charles covers why:
- Exits determine the trade outcome
- Exits influence position-sizing
- Exits even affect the number of trades
Explanation of why exits are overlooked, difficult to implement, and are neglected by traders is
also covered. The actual information on the different types of exits and why you would use them is excellent.
Charles covers:
- Chandelier Exits
- Yo-yo exits
- Channel Exits
- Moving Average Exits
Emphasis on the importance of the Average True Range as a measure of volatility and how to define
exits that adapt to changes in volatility is also discussed.
In a world where most trading material is about the next greatest entry technique, this presentation
is a very refreshing change - I wish I had seen this much earlier in my trading career, but I probably would have ignored
it as irrelevant anyway.
Read other InvestorFLIX product reviews here
Visit InvestorFLIX
_______________________________________________________________________________________
If optimization is the answer, what's the question?
Paul King, May 7th 2007
Optimization of your trading systems is a very tempting thing to do.
If there are enough degrees of freedom (parameters) in your trading system then lots of fiddling and testing different combinations
of values for those parameters will yield virtually any results you are likely to want. As long as you have enough historical
data to test on, you can find an "effective" version of your trading system to trade it.
This approach is completely flawed by the simple fact that given enough
data, and parameter settings, the results you observe are completely due to chance. Randomness can observe very compelling
patterns if you have enough data and enough tests.
So, is optimization useless? In my opinion, no, but it is very dependent on a) the way you interpret your results
and b) exactly what historical data you use and c) the degrees of freedom in your trading method.
I recommend taking historical testing results and simulating the variability of returns they could produce rather than
simply taking the single equity curve generated as your answer to "what your trading method looks like". Simply changing
the ordering of the trades you get can significantly affect the equity curve produced.
Also, don't optimize on you whole data set and then expect the future to look like the past. At the very least
optimize on half of your data and then see how performance differs using the other half. A better way would be to create
synthetic data streams for your source data and apply your system to those rather than use the actual historical data.
This is beyond the scope of a simple blog.
Additionally, the fewer degrees of freedom your system has, the less prone it can be to curve fitting. Most of
my trading systems have very few (one or two) actual configurable parameters that can be optimized.
Lastly, remember that net ending equity is not the only characteristic of your trading system you can optimize for.
What about trade frequency, average winner size, average loser size, equity curve volatility, maximum drawdown? These
are all features of your trading system that may be as important to you as actual net return.
A sound trading idea does not have to be endlessly "tweaked" for optimum performance; it should work within your requirements
for a large range of possible parameter values.
_______________________________________________________________________________________
Tradecision Trading System Software
Paul King, April 30th 2007
Tradecision is a very comprehensive trading system design, testing, simulation,
and execution software package that has more features than the average systematic trader will ever need. As with all trading
software it's the things it can't do that are most revealing and the list for Tradecision is quite small and relatively insignificant.
What it can't do (not much)
- It can't test a trading strategy on a variable list of symbols determined
by a historical daily scan (but what trading system software can do this?)
- It doesn't have global variables that are available in each section of the
trading strategy so you would have to write a custom dynamic link library (DLL) to achieve this.
- A running total account value is not available in the custom position
sizing section so you can't program a percent-risk position-sizing model (although this feature I'm told will be available
in future releases).
What it can do (a lot)
There are plenty of useful features in this software. As well as the standard
charts (historical and real-time), indicators (very comprehensive), and alerts, there are a selection of major functional
areas that are very useful for designing, testing, and executing automated trading systems. The main ones include:
- Data Manager - quickly and easily retrieves historical data from multiple
data vendors and timeframes.
- Neat Scan - a filtering and scanning tool.
- Strategy Builder
- fully-functioned trading strategies defined using a programming language "Improvian".
- Simulation - a comprehensive strategy back testing feature.
- Execution - ability to automatically send strategy orders to Interactive
Brokers.
As well as these major functional areas there are other tools to handle streaming versus real-time
data, a neural network model, and facilities to call external code/programs using the dynamic link library (DLL) module.
There is also comprehensive online help and most features are accessed using "wizards" and structured
dialogues rather than having to learn the programming language immediately. This allows a novice user to utilize the
built-in functions easily, but is also flexible enough for the advanced professional user.
Read the rest of the review here.
Visit Tradecision here.
_______________________________________________________________________________________
The Black Swan by Nassim Nicholas Taleb
Paul King, April 23rd 2007
The familiar bell curve, or Gaussian distribution that is the foundation of many economic, financial, statistical,
and mathematical models in use today works perfectly for applications where huge outliers (far from average) events don't
exist and each individual event has little effect on the overall average.
An example would be the distribution of heights for homo-sapiens. One will get a lovely bell curve where
many people cluster around the average height and proportionally less occurences of individuals as you move above (taller)
or below (shorter) the average. You will never suddenly come across someone of zero height or 20 feet tall.
Taleb goes into forceful, irreverent, and interesting detail to show that life just doesn't work like the
standard models assume, and that it is basically very foolish to rely on them or anyone who makes predictions or manages risk
using them. It probably would have been even more interesting to see the "uncensored" manuscript before the publisher/editor
made their changes.
This book does cover some of the same ideas as Taleb's previous (excellent) effort Fooled By Randomness. It is probably due to the commercial success of that book which allowed Taleb the latitude to write The Black
Swan without "pulling any punches" and articulate what he really thinks about the established academic, modeling and
prediction businesses (especially in economics and finance).
A very interesting, entertaining, insulting (for various academics) and eye-opening read that should change
the way you look at a bell curve, standard deviation, and any "expert" predictions in the future.
View the other non-trading books I recommend here.
_______________________________________________________________________________________
An (almost) 100% accurate forecast
Paul King, April 16th 2007
If I was a meteorologist, people would definitely hate my weather
forecast. It would look something like this:
Weather today in Middlebury Vermont as of 8:54 AM EST is cloudy. Rain so far today is 0.5 inches,
snow or other precipitation is 0.25 inches. Temperature is 25 degrees Fahrenheit. Five day forecast is from 0
to 10 inches of rain, 0-24 inches of snow, temperatures between -5 degrees F and 65 degrees F.
This forecast is a) all made up, and b) would be based on historical weather for this day in history plus 5
standard deviations from average (just to be on the safe side). How useful is this as a forecast to determine whether
you should wear snow boots, take an umbrella, or if it's safe to swap your snow tires for summer tires? Not at all.
But neither is an absolute prediction that's wrong most of the time....
What does this all have to do with trading? Well I go about trading the same way that I would construct
a weather "forecast". All we know is what price is doing right now, what it's done in the past, and then expect it to
do something similar in the future based on current estimated volatility. This tells you the likely range of price of
a move (but not the direction).
Picking the next "big winner" is not effective, or even possible for a chaotic system like a market of stocks.
So if stock-picking isn't the answer, what is it that makes money? Having a good exit strategy that keeps losers small
relative to winners, and position-sizing to prevent you exceeding your maximum desired drawdown. That's what makes the
money.
Then, assuming you trade liquid instruments, it doesn't really matter what happens next - you'll capture
some part of things that trend and keep your losers as small as possible. Unlike weather prediction, it doesn't matter
if you're wrong more than you're right as long as the size of the winners is bigger than the losers overall and you can tolerate
the length and duration of your draw-down periods.
Luckily for meteorologists there is no formal feedback process that tells them how good (or bad) a job they
are doing unlike trading where your monthly brokerage statement doesn't lie.
What exactly does an 50% chance of rain mean - you should take half an umbrella out with you?
_______________________________________________________________________________________
The drawbacks of using maximum drawdown
Paul King, April 9th 2007
Maximum historical drawdown is a useful piece of information to calculate
for a particular trading method, but it only gives you a very one-dimensional view about how much risk you are actually taking
with a particular trading method.
If your trading has a "short option" profile, like the metaphorical "picking up nickels in front of a steam-roller",
then historical maximum drawdown will completely under-estimate the size of potential losses going forward. Returns
could appear consistent and drawdowns tiny, but this does not take into account the small risk of a catastrophic loss these
trading methods represent.
Additionally, even if your trading has a trend-following, "long option" profile, it is the variability
of results that is important in setting your position-sizing, not just the single largest historical drawdown. Simply
getting your trades in a different order can make a huge difference on the maximum drawdown.
Rather than look at the historically largest peak-to-trough drawdown in my trading systems, I prefer to
use simulation to discover a likely range of equally possible equity curves. This can then be used to position-size
to stay within my tolerance for risk, and will hopefully give me a more accurate estimate of "what bad looks like" than a
single drawdown figure.
No single measure of a trading system can capture all relevant information regarding your requirements for
performance, trade frequency, and risk so don't put too much emphasis on one behavior of your trading method to the exclusion
of the others.
_______________________________________________________________________________________
Stop and reverse trading
Paul King, April 3rd 2007
Some trading methods are in the markets they trade 100% of the time.
These kind of systems use a so-called "Stop and reverse" (SAR) method where the exit of one trade is the entry of the next
trade (in the opposite direction). An example would be entering long when the price crosses above a moving average and
short when it crosses below.
Although there is a neat symmetry to these kinds of techniques, and
you never have to wait for the next signal since you are always in a position (either long or short), I don't use this kind
of SAR technique for the following reasons:
1 Any financial instrument is not suitable for trading all the time. There will be periods
where there is lower volume, lower volatility, and conditions are just not suitable for entering (or even remaining in) a
position. SAR techniques do not allow you to be "out" when conditions are not suitable for your method. Just like
most mutual funds!
2 Although many techniques can be suitable as an indication to get into a trade, this does not automatically
guarantee that the same time is a good place to exit an existing position. Getting long when a price crosses above a
moving average is a reasonable way of determining a trend has started and "hopping aboard". Just because the price has
crossed back below a moving average does not necessarily mean it's a good time to a) exit the trade, and b) enter a position
in the opposite direction.
3 SAR techniques can have unsuitable, or undefined, exit points at the time you enter the trade.
If price has just crossed a moving average, for example, your initial stop (if you will exit when price goes back through
the moving average) could be very close to the current price. This could cause multiple "whipsaw" losses if price oscillated
back and forth around the average.
4 If your entry/exit is a combination of various indicators it may not be possible to estimate where your
exit and reversal point will be in advance. This makes it difficult to manage risk and position-size effectively.
I'm sure some traders utilize SAR techniques very effectively, but I don't use them and prefer
to have completely separate methods for entering and exiting a trade. After all, they are completely separate components
of your trading system, so why should they be "optimized" together into one decision?
_______________________________________________________________________________________
Testing entries with random exits?
Paul King, March 27th 2007
There has been some recent discussion on the trading forums I frequently
read about random entries and exits. Here is my opinion on this subject.
I believe that an entry's predominant characteristic is setting trade
frequency and entering trades at times where there is the least chance of stagnation of price movement and most
chance of continuing high volume. This helps to minimize slippage and also reduces the chances of a "flat line" trade that
uses up capital, takes risk, and achieves no return.
If there is any predictive nature to entries in any market, one
has to think about the likely time period over which the entry pattern is predictive of future prices. If this time period
is shorter than the average duration of trades, it is practically insignificant to your overall trading results.
I
would/could consider trading a random entry assuming it was chosen from a liquid universe of instruments and I had the choice
whether to take the trade or not. I would never consider trading a random exit under any circumstances. This to me indicates
my beliefs about the relative importance of entries and exits. Other traders may have a different opinion.
Attempting
to test an entry by using some kind of random, fixed-bar exit is not really representative of real-life trading. Further,
a fixed bar random exit basically takes unlimited risk between entry and exit - price could go anywhere and you would not
exit. This overestimates the returns of any trading method compared to "real" trading where one normally limits risk during
the trade in some way (unless you want to blow up your account at some point).
Broker selection, liquid instrument
selection, setup, entry, exits, and position-sizing all combine to create a particular instance of a trading system. In my
opinion setup/entry influence your trading results the least out of all components, but that doesn't mean they have zero effect.
Trade frequency is much more important in my opinion than some short-term predictive anomaly associated with an entry.
I
know this goes against the grain with most traders, but isn't that what the fabled "search for the holy grail" of trading
is about - finding so-called "accurate" entry signals? Since I believe that winning percentage is determined by exits not
entries, "accurate entry signal" is an oxymoron to me.
Testing trading methods as a consistent "whole" that most closely matches the way you are going to trade
for real is an effective approach that does not put too much or too little emphasis on any one trading component. My
trading system component model is a useful model, but it's not the only way to think about how trading methods fit together.
Examining the effects of changing individual components of a trading method often yields useful (and counter-intuitive) results.
Try reversing the side (long or short) of an entry signal for a compete trading system leaving everything
else in place, and see what effect that has on the overall expectancy of the system. The results may surprise you.
_______________________________________________________________________________________
Q1 2007 Blog
Q4 2006 Blog
If you find this Blog useful and informative then please make a donation so I know I should continue to publish it.
(I might even send you an eBook or Article ;-)
|
|
|
|
|
|
|
|


 A
(Usually at Least Weekly) Trading Blog
A
(Usually at Least Weekly) Trading Blog


 The User Guide has now been written and is available here.